Marketing Attribution, Inteligência Artificial e Teoria dos Jogos

An increasing number of companies have asked me about multichannel marketing attribution , especially after posting the popular white paper and webinar on this subject. Two of the most frequently asked questions I received were:
- Why do I need game theory to conduct a marketing assignment (and how does a Shapley Value work )?
- Why do I need a predictive model to do marketing attribution?
I will address these two issues in a journey that will intersect different scenarios, which should help to eliminate any confusion.
CASE 1: NO MARKETING TOUCHPOINT
Let’s start with the easiest scenario: there are no marketing touchpoints and your sales reached a total of R $ 1,000. If there are no marketing touchpoints , the value of R $ 1,000 in sales is the baseline – no sale is attributable to marketing and the attribution is trivial.
CASE 2: A TOUCHPOINT MARKETING
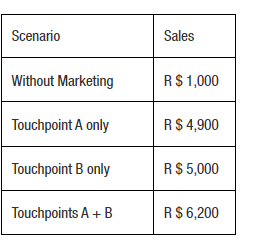
You want to increase sales, so start selling using your touchpoint A and your sales increase to R $ 4,900.
If you have resorted to the popular but obsolete and doomed to failure methodology of the “last touchpoint “ , you will assign all sales to touchpoint A, with a value of R $ 4,900. This approach, however, is incompatible with economic theory, which postulates that the value of a good or service is its marginal utility . You had already reached R $ 1,000 in sales, so touchpoint A is worth R $ 4,900 – R $ 1,000 = R $ 3,900.
Phew, it wasn’t even that hard to calculate!

CASE 3: TWO MARKETING TOUCHPOINTS
Driven by marketing success with touchpoint A, you add touchpoint B. Sales increase to $ 6,200. You quickly conclude that touchpoint B is worth $ 6,200 – $ 4,900 = $ 1,300. However, you are about to learn that this is not how it works. While you are away, your team forgets to manage touchpoint A and, for a period, you will only have touchpoint B in progress. Sales will drop to $ 5,000. After returning from his break and restoring touchpoint A, sales are resumed to $ 5,200.

When you reactivated touchpoint A, sales increased by R $ 1,200. Does this mean that touchpoint A is really worth R $ 1,200? Or is it worth R $ 3,900, as we calculated in the section that considers only a touchpoint ? If, with touchpoint B, you earn sales of R $ 5,000, does that mean that contact point B is worth R $ 5,000 – R $ 1,000 = R $ 4,000? Or is it worth R $ 1,300, according to the previous paragraph?
What we know is that the total value of A plus the value of B must be equal to R $ 6,200 – R $ 1,000 = R $ 5,200.
We need a solution such that:
A + B = 5200 and
1200 <= A <= 3900 and
1300 <= B <= 4000
With respect to the example above, there is a range of values for A and B that satisfies all of these conditions, however, as we add more touchpoints , we will find that, in fact, there is only one general solution that works for several touchpoints – the Shapley value . If you search online, you’ll find a complicated-looking formula:

But if you use the examples given, you will begin to understand that, in fact, it is quite simple. Just get all the assignment orders, measure the marginal contribution of each one and get the average.
Regarding our example, the Shapley Values are:
Point of Contact A = (1200 + 3900) / 2 = R $ 2,550
Point of Contact B = (1300 + 4000) / 2 = R $ 2,650
Wow, much simpler than the other very complicated formula!

CASE 4: THREE TOUCHPOINT MARKETING
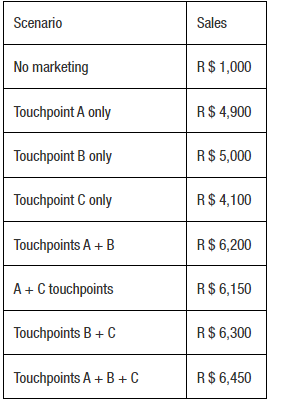
You want to get more sales and start adding a third marketing touchpoint , with an increase in sales of R $ 6,450. At this stage, your intention is to calculate the value of touchpoint C and review the values of touchpoint A and B. To do the calculation, you need to know the values of all combinations of A, B and C and the expected sales for those combinations , as indicated below:

To obtain the Shapley Value for C, we calculate the average marginal contribution of C in each of the scenarios that contains C:
(Touchpoint C) – (without marketing), and
(Touchpoints A + C) – (only with Touchpoint A) and
(Touchpoints B + C) – (only with Touchpoint B) and
(Touchpoints A + B + C) – (Touchpoint A + B)
The calculation of the Shapley Value for C is:
((4100-1000) + (6150-4900) + (6300-5000) + (6450-6200)) / 4 = (3100 + 1250 + 1300 + 250) / 4 = R $ 1,475
Similar calculations can be used for Touchpoint A and B:
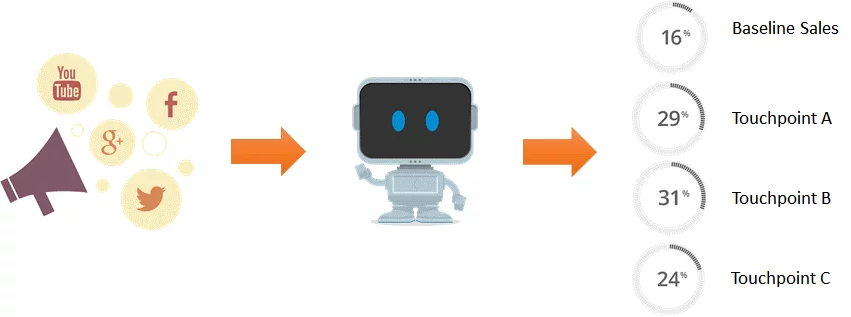
Shapley’s Value for A = R $ 1,825
Shapley’s Value for B = R $ 1,950

WHERE DO SALES ESTIMATE SCENARIOS COME FROM?
In the previous sections, I described a situation in which a company could conduct natural experiments that showed how sales vary with each possible combination of touchpoints . It is an uncomplicated task when we have only 1 or 2 marketing touchpoints , but in the last case (Case 4), I demonstrated the calculation of a set of eight scenarios, including the sales of different combinations of touchpoints . As the number of touchpoints increases, the number of scenarios grows exponentially.
IF THERE ARE 10 POINTS OF CONTACT, YOU WILL NEED TO KNOW SALES ESTIMATES FOR 1024 SCENARIOS!
In digital marketing, it is not uncommon to have 30 or more touchpoints before a sale. Under these circumstances, it becomes impractical to perform AB tests for all possible combinations of touchpoints .
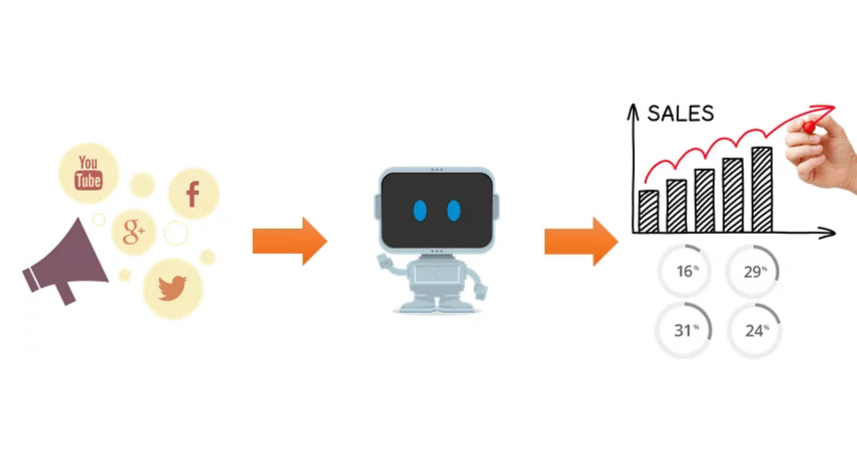
The solution is to create an AI (an Artificial Intelligence system) that makes it possible to predict the results of each scenario based on the combinations of sales and touchpoints observed in the historical data.

BUILDING AN AI CAN BE DIFFICULT AND TIME CONSUMING …
Building these predictive models is difficult. In general, it requires teams of data scientists to model and manually test machine learning algorithms . This task can take months, even if we start from the premise that you will find data scientists, which is missing. By the time AI is built, consumer behavior may have already changed.
A NEW AND UNCOMPLICATED WAY – AUTOMATED MACHINE LEARNING
The solution is automated Machine Learning , like DataRobot , a specialized system that, at the click of a button, is able to quickly find the most accurate machine learning algorithms , as well as data preparation techniques for your specific data. Instead of waiting weeks or months, you could have a solution in hours or less. In addition, DataRobot will provide easy explanations of what AI is doing, so you can trust your decisions.
Article created by Colin Priest
To learn more about Automated Machine Learning,
start by understanding DataRobot.
Compartilhe


